What Is a Good Average Order Value on Shopify?
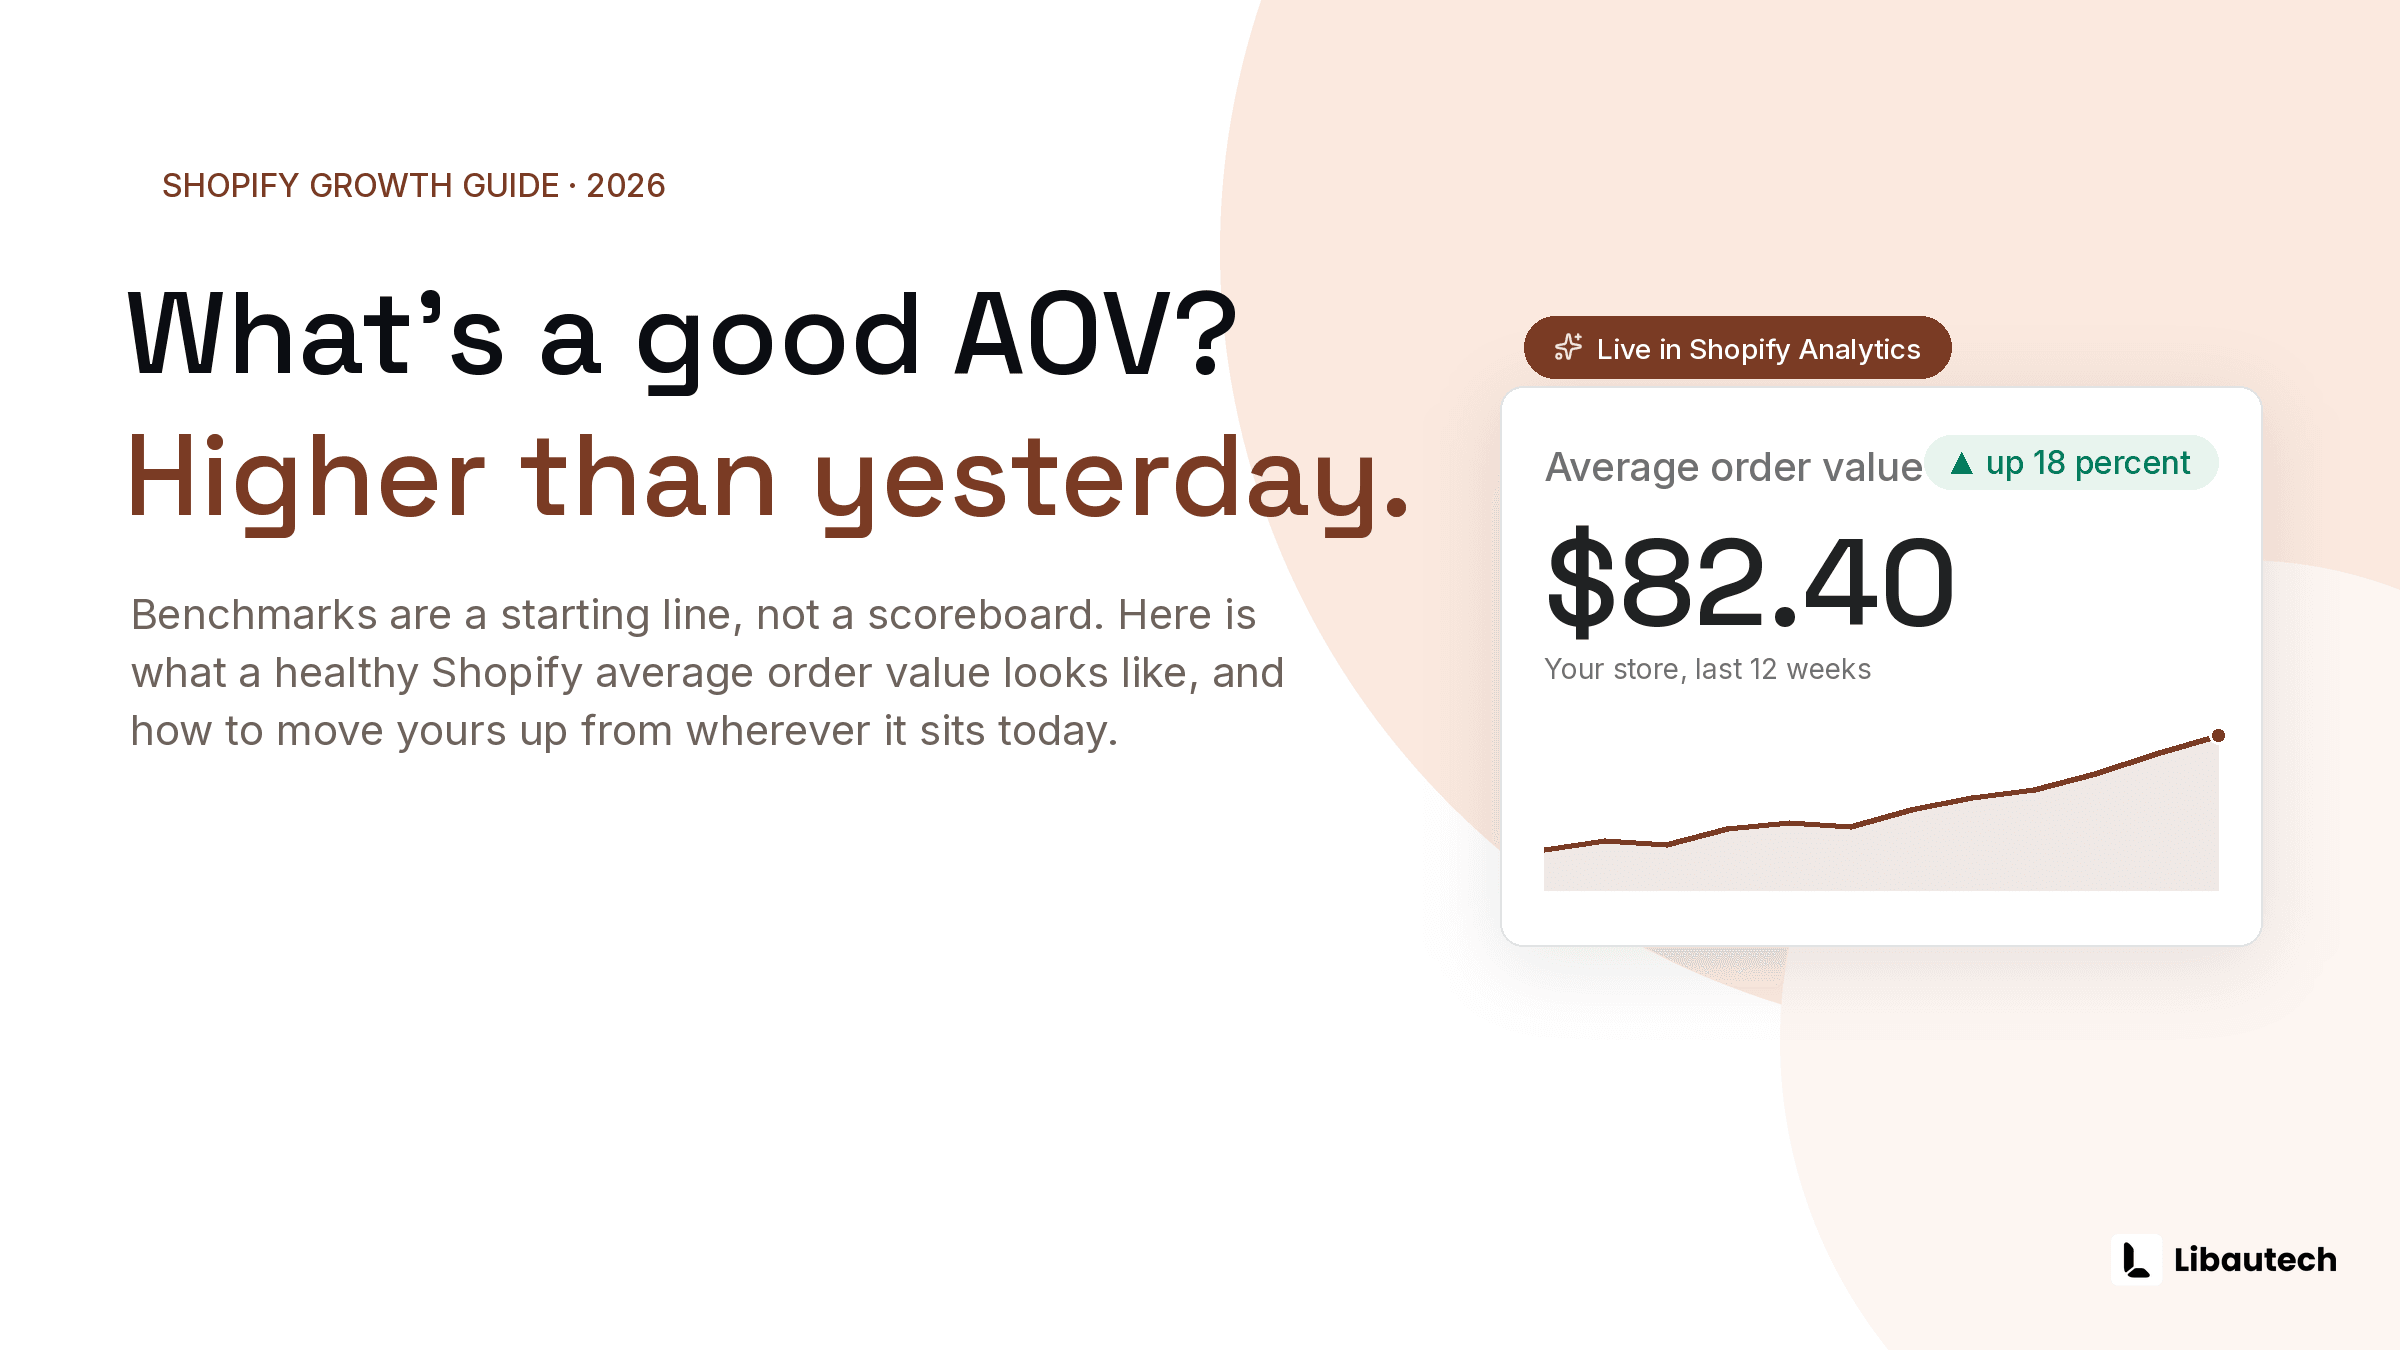
Average order value (AOV) is total revenue divided by number of orders, and a good AOV for a Shopify store is one that is higher than your own trailing 30 days, because AOV is a function of your price points and catalog far more than of any industry standard. Published cross-industry figures generally place typical ecommerce AOV somewhere in the 50 to 150 USD band, with fashion and beauty toward the lower half and furniture, electronics, and B2B far above it, but comparing your number to another category's benchmark tells you almost nothing actionable.
Across the 1,133 Shopify stores in our data with order history, the median AOV was $49.28, and $80.24 among US stores. The number swings hard by market and catalog, which is why the only benchmark that matters is your own baseline, and the useful question is which mechanics move it.
TLDR: Key Takeaways
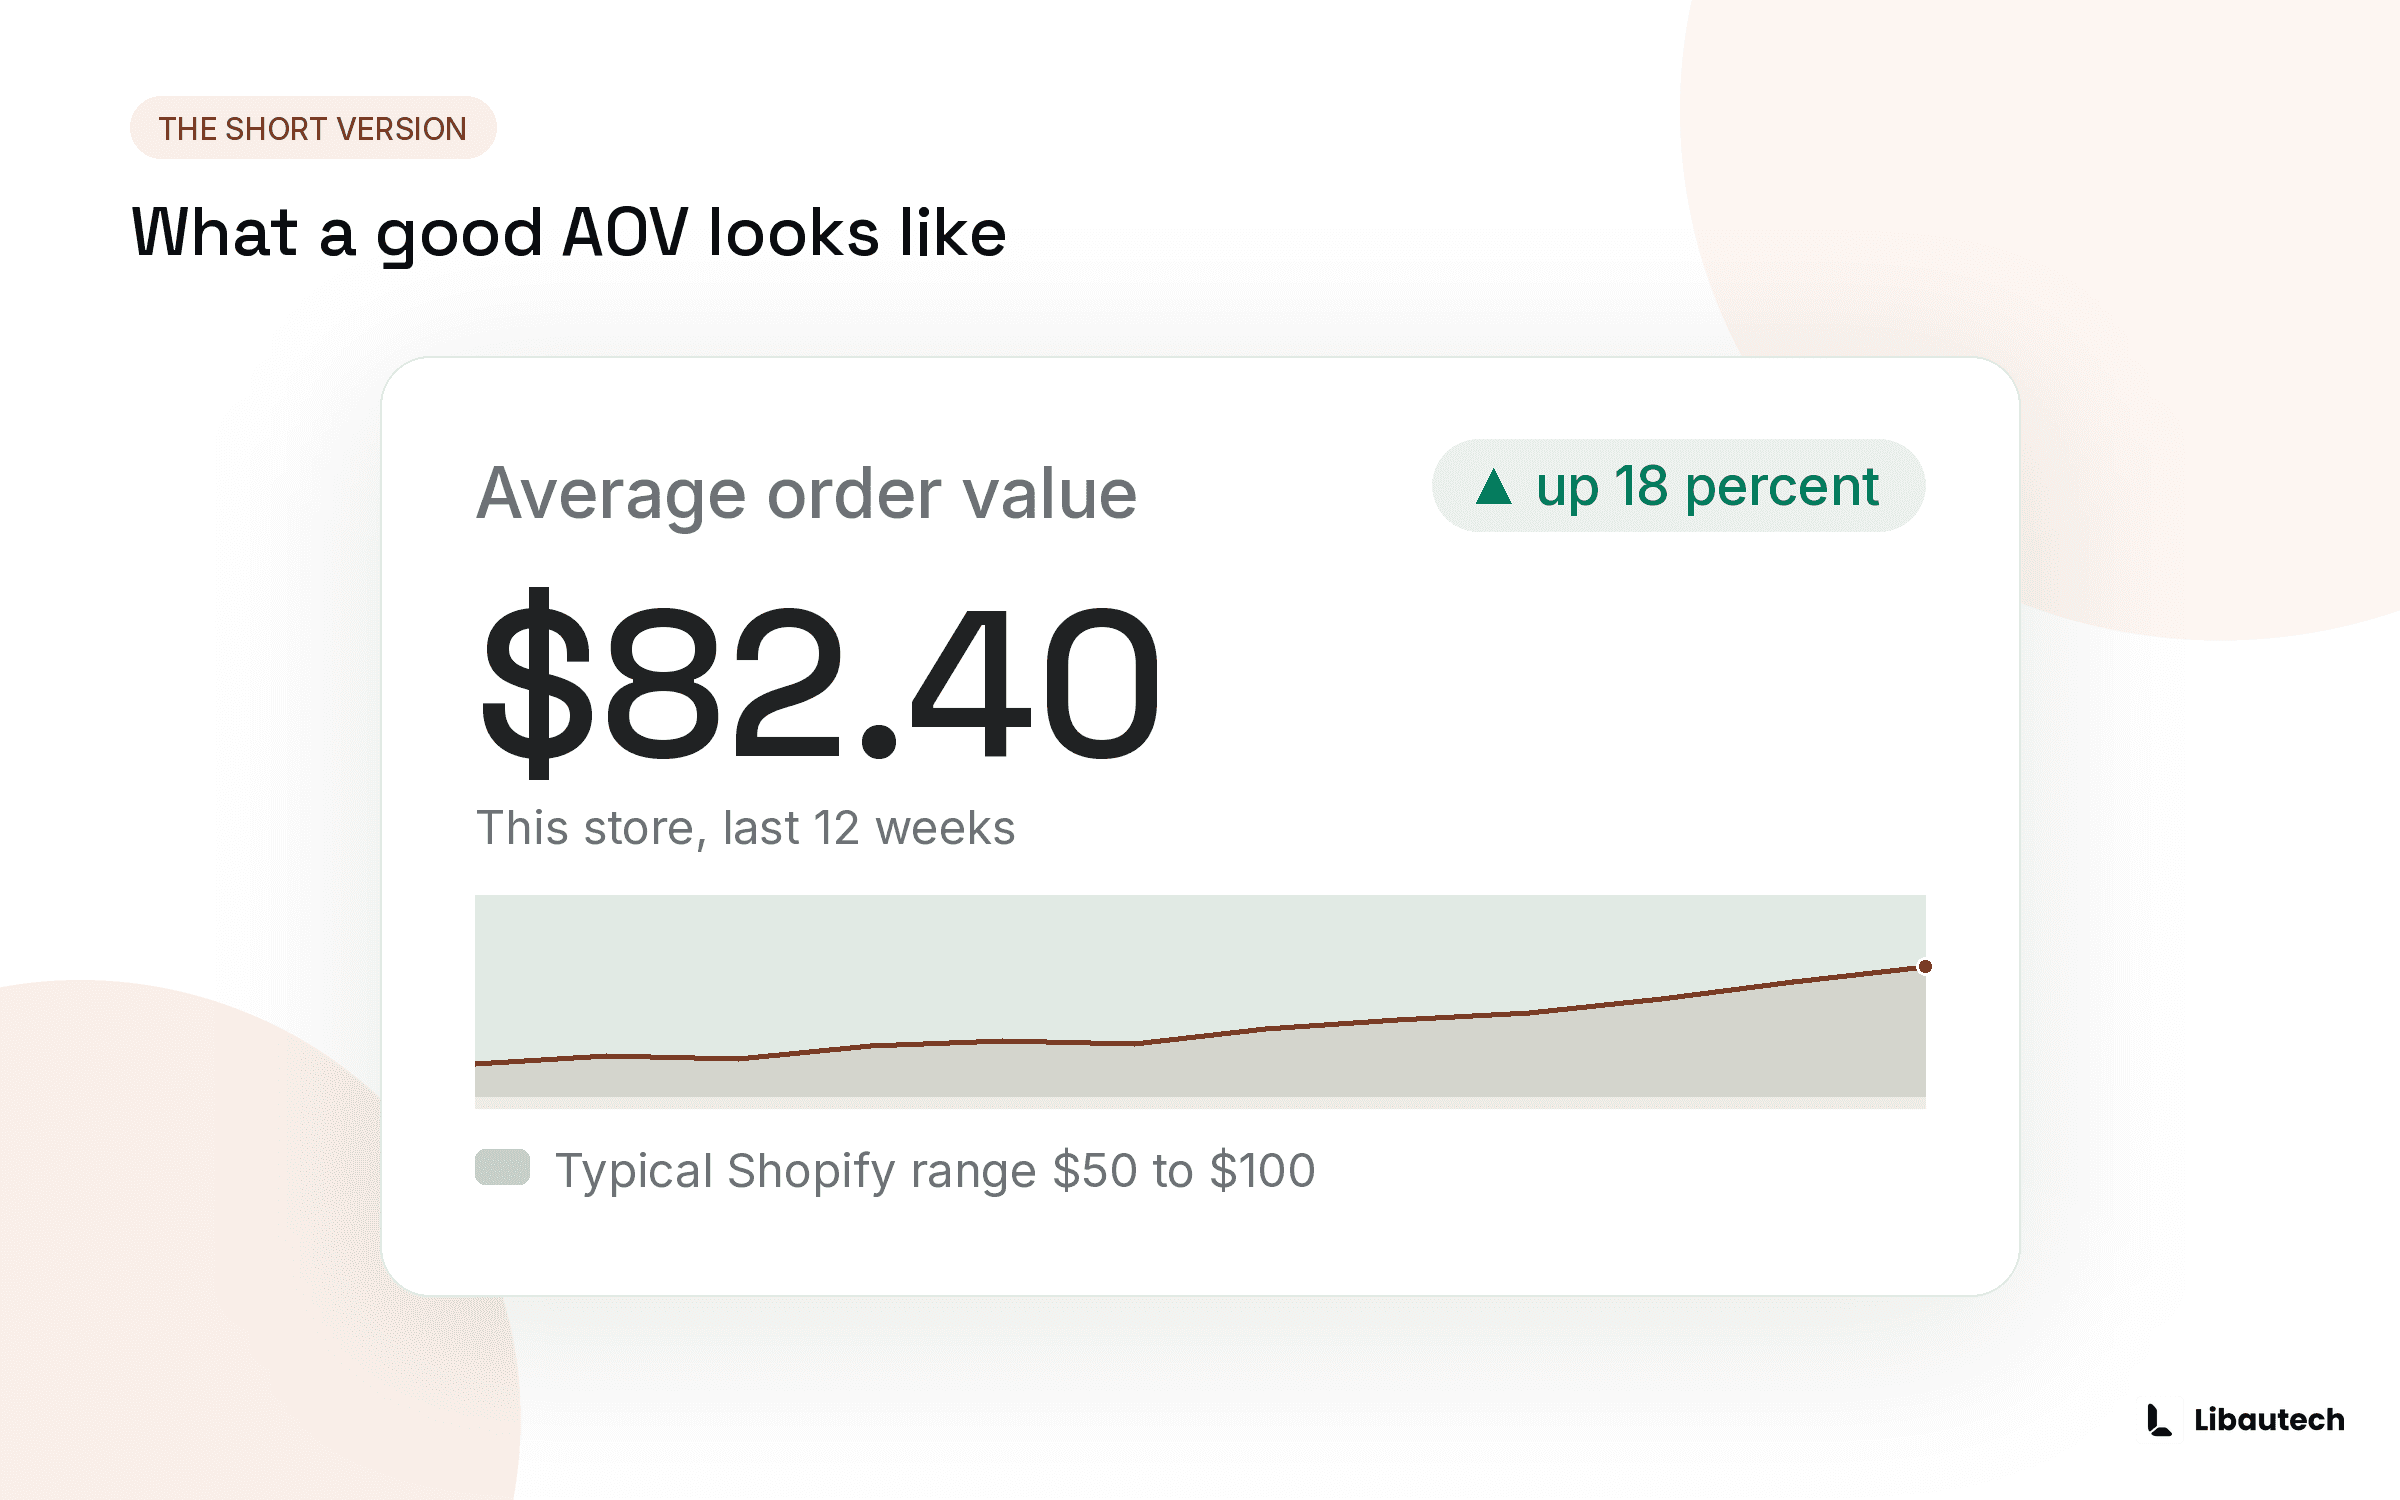
- AOV = total revenue divided by total orders, over a defined period. Shopify Analytics reports it directly.
- Across 1,133 Shopify stores we measured, the median AOV was $49.28, and $80.24 in the US (n=202). Yours depends on your market and catalog.
- Category dominates the number: a 35 USD AOV can be excellent for accessories and alarming for furniture. Benchmark against your own trailing 30 days, not the internet.
- Track margin per order next to AOV; an AOV lift bought with deep discounts can shrink profit.
- The 3 fastest movers: quantity breaks on consumables, a free shipping threshold set 15 to 25 percent above current AOV, and 1 cart offer at the add to cart moment.
How Do You Calculate Average Order Value?
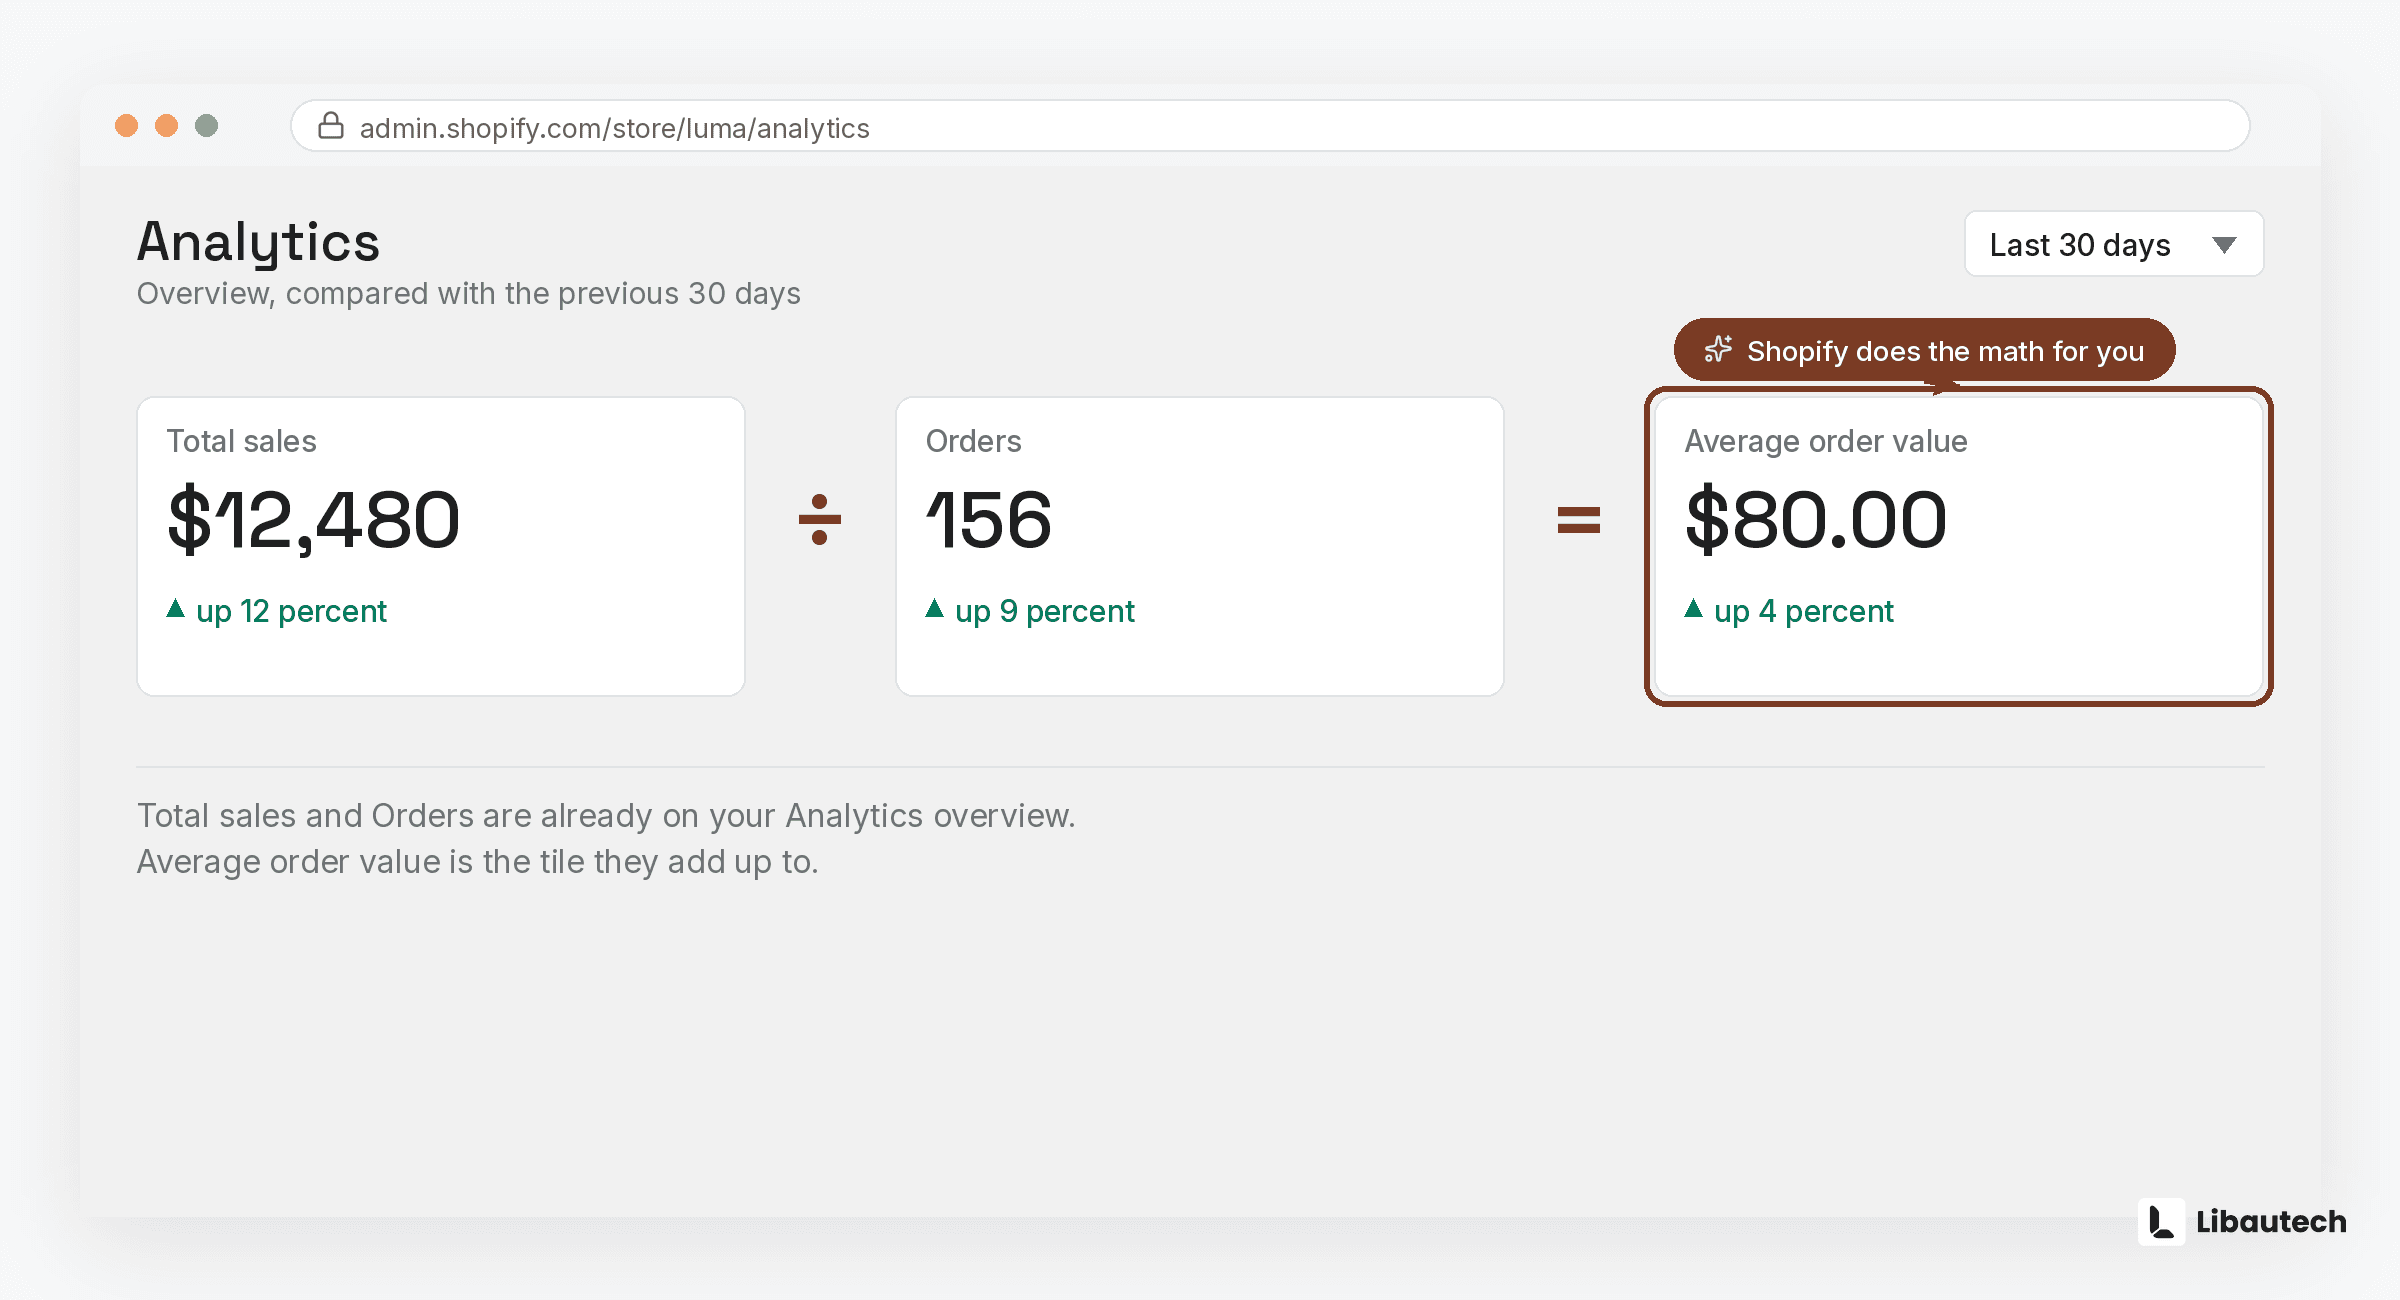
Divide revenue by order count for the same period. A store with 24,000 EUR in revenue from 480 orders in June has a June AOV of 50 EUR. In Shopify, open Analytics and the Average order value report gives the figure directly, with date comparisons. Two hygiene points: measure a consistent window (trailing 30 days works), and decide once whether your figure includes shipping and taxes, then never mix definitions between comparisons.
What Is the Median Shopify AOV? (Measured Across 1,133 Stores)
Most published AOV figures are estimates. These are measured. We pulled 12 months of order data from Shopify stores using our apps, computed one AOV per store, then took the median across stores.
| Group | Median AOV | Stores |
|---|---|---|
| All stores with order data | $49.28 (p25 $25.73, p75 $98.51) | 1,133 |
| US stores, 10+ orders | $80.24 | 202 |
The global median is about 49 USD, but a US store sits closer to 80. That gap is the point: AOV depends on your market and catalog, not on a universal target.
By store size, using each store's order count over the year:
| Store size | Median AOV | Stores |
|---|---|---|
| Under 100 orders/year | $44.21 | 710 |
| 100 to 1,000 orders/year | $64.96 | 226 |
| 1,000+ orders/year | $53.36 | 197 |
The largest stores by order count do not have the highest AOV. High-volume stores skew toward lower-priced, high-repeat consumables, so more orders does not mean bigger baskets.
AOV also varies sharply by market, shown here in each store's native currency:
| Currency | Median AOV (native) | Stores |
|---|---|---|
| USD | $72.20 | 333 |
| EUR | €55.17 | 225 |
| INR | ₹1,007 | 124 |
| GBP | £33.85 | 74 |
US and Eurozone stores run highest, UK and high-volume emerging-market stores lower. Forty-six smaller currencies had too few stores to report on their own.
How We Measured This
- Source: 12 months of order data from Shopify stores using Libautech's apps, part of 26,000+ lifetime installs across 50+ countries. No individual store is named or identifiable.
- AOV is computed only from the 1,133 stores that have Shopify order-value data. The US, 10-plus-order subset (202 stores) is the cleanest single-currency figure.
- One AOV per store, then the median across stores. Medians lead, with p25 and p75.
- Currency converted to USD via exchangerate-api.com, snapshot 31 August 2026. Native-currency medians are shown for currencies with 30 or more stores.
- Limitation: these order records carry no refund flag, so fully refunded orders are still included. Read the figures as gross AOV.
What Is a Good AOV by Store Type?
Directionally, from published cross-industry reporting and what I see across merchant data:
| Store type | Typical AOV band (USD) | Why |
|---|---|---|
| Accessories, beauty, consumables | 25 to 60 | Low unit prices, offset by repeat purchase |
| Fashion and apparel | 60 to 120 | Mid unit prices, multi-item carts common |
| Home, electronics | 100 to 250 plus | High unit prices, single-item orders common |
| Furniture, B2B, wholesale | 250 plus | Big-ticket or bulk by nature |
Treat these as orientation, not targets. A consumables store at 40 USD AOV with a 60 percent repeat rate is a better business than a furniture store at 400 USD with razor margins and no repeat purchases. Which is the second point: AOV is 1 input to revenue per customer, not the scoreboard by itself.
Why Do AOV Benchmarks Mislead?
Three reasons. Mix effects: the same store's AOV swings with its traffic mix, since sale-period and discount-code traffic buys smaller. Definition drift: sources differ on whether shipping, taxes, and refunds are included, so cross-source comparisons wobble by 10 to 20 percent on definitions alone. And survivorship: published benchmarks over-represent large stores. The comparison that survives all 3 problems is you versus you, 30 days ago, with seasonality noted.
How Do You Raise Your AOV From Wherever It Is?
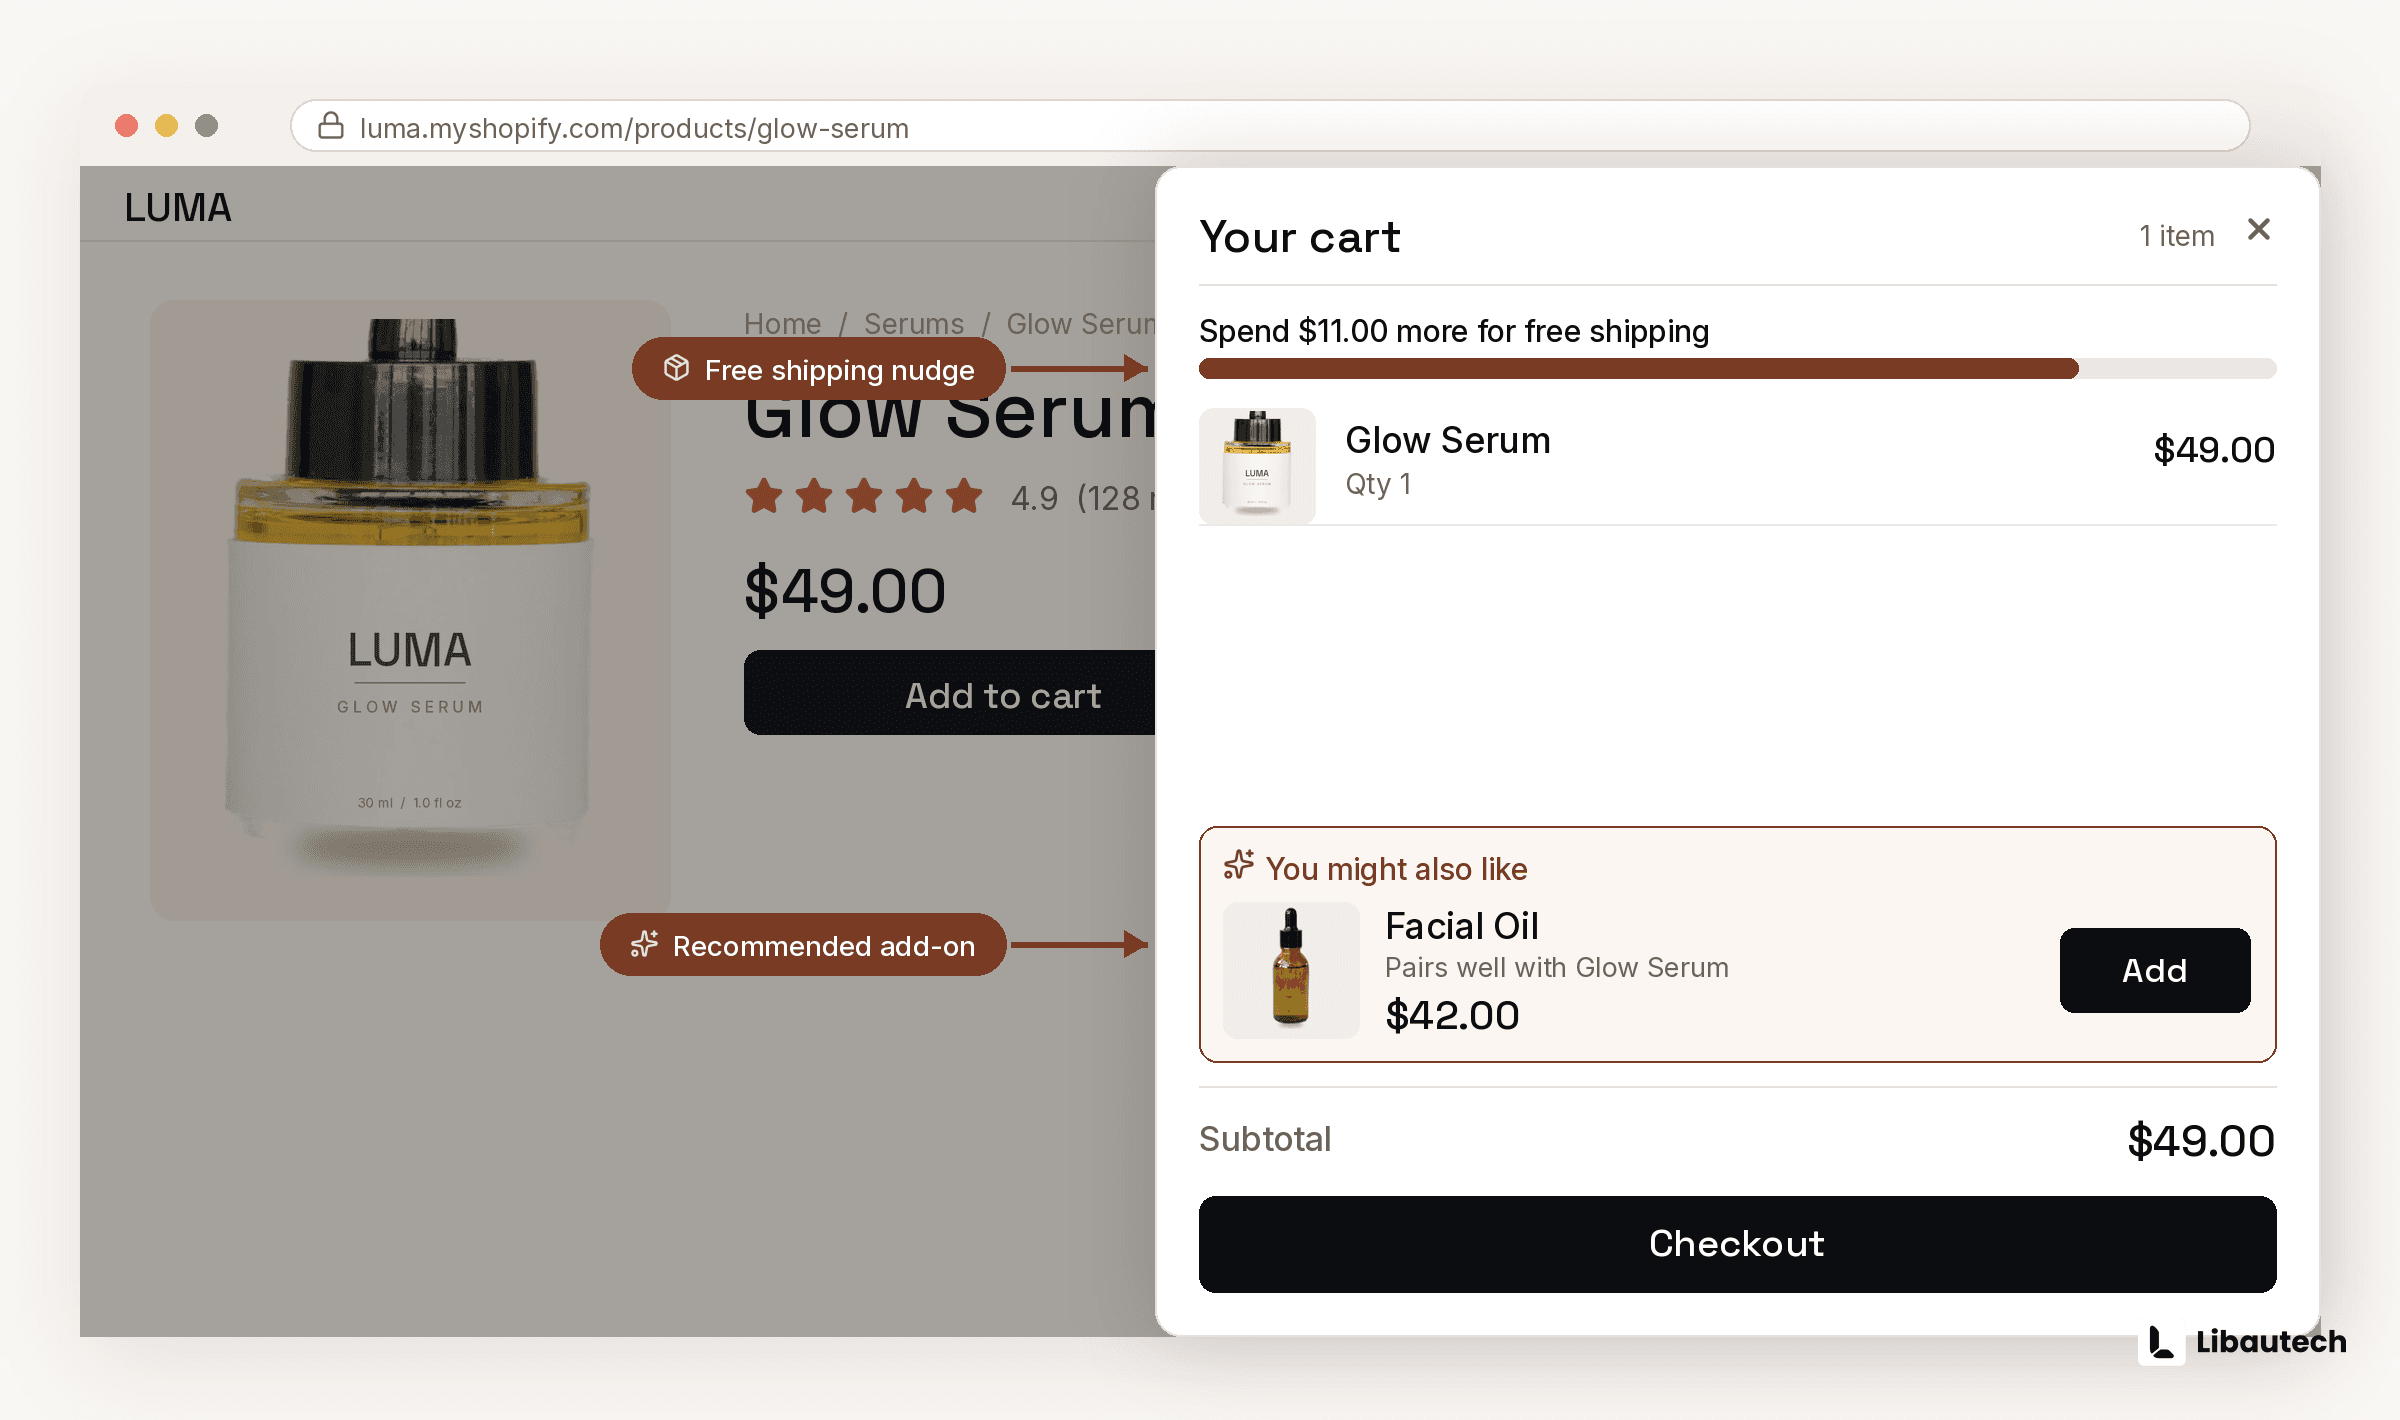
The mechanics are the same at every starting point; only the offer content changes. The 3 fastest movers, each under 30 minutes to set up: quantity break tiers on anything customers use up, a free shipping threshold set 15 to 25 percent above current AOV with a progress bar, and a single cart popup offer firing on add to cart with a complement at 25 to 50 percent of the main item's price. Then frequently bought together on bestsellers and a post-purchase 1-click offer as the second wave. All the offer mechanics above run from Libautech Bundles & Upsell (Built for Shopify, 7-day trial); the full playbook is in our guide to increasing average order value.
Measure weekly against the pre-change baseline, and hold margin per order next to AOV so a discount-fueled lift does not masquerade as growth.
Related guides: How to upsell on Shopify, 15 product bundle ideas, Product add-ons and free gifts and 12 Shopify upsell examples.